Studying the health impacts of cumulative blue light exposure from digital devices on cognitive performance.
By Nishant Bansal under the guidance of Prof. Parveen Kalra, Prof. Neelam Rup Prakash and Dr. Jagjit Singh Randhawa

Centre of Excellence In Industrial and Product Design
PEC University of Technology, Chandigarh
ABSTRACT
Many people spend their leisure time in front of computers, laptops, and mobiles which are equipped with LED devices. These devices have a tendency to emit high energy short-wavelength blue light. Exposure to short-wavelength (450-480nm) blue light can cascade number of effects on our cognitive functions. Several products are available in the market, which blocks harmful blue wavelength light. Therefore, a study was conducted to find the effects of blue light on cognitive performance using a screen cover that blocks blue light (RPF 30). Seven healthy male participants were exposed to LED screen and blue light filter screen. It was hypothesized that cognitive performance of participants will decrease under the exposure of LED screen as LED devices emit blue light. During the 5 hour daytime study, participants were exposed to two different screen interfaces for three and half hours (3:30 hrs) under a controlled environment. A series of cognitive tasks were performed by the participants during the study and further analyzed by using various statistical methods. Results have shown that there was a significant difference in EEG delta theta activity, mood, sustained attention (reaction time task), short term memory (verbal memory task), and active memory (visual memory task) for two types of screen interfaces. Continuous exposure to LED screen has led to decrease in frontal region delta theta activity and increased alertness. Participants who were exposed to LED screen were more alert throughout the study as compared to blue light filter screen participants. Exposure to blue light filter screen has elevated memory performance and mood in participants. Thus, continuous exposure of blue light, emitted by LED screen was found harmful for mood, memory performance, attention and sleep.
INTRODUCTION
The evolution in digital screen technology has advanced dramatically over the years. Over 3.6 billion people use the internet, and this number is rapidly increasing. Almost half of the world population is using the internet. In 2017 around 1.1 billion computers, television sets, and cell phones were sold globally, which illustrates the numbers of individuals who spend time in front of computer screens, video game consoles, or other video monitors. Until the advent of artificial lighting, the sun was the major source of lighting, and people spent their evenings in darkness. Nowadays, we are surrounded by artificial sources of light. These electronic devices use LED backlight technology to help enhance screen brightness and clarity. These LEDs emit very strong blue light wavesin the short-wavelength region (i.e., the blue range at ~460 nm). Cell phones, computers, tablets and flat-screen televisions are just among a few of the devices that use this technology. Because of their wide-spread use and increasing popularity, we are gradually being exposed to more and more sources of blue light and for long periods of time.
Here, an LED backlit laptop was used to study the effects of blue light on cognitive performance. On the other hand a blue light filter can block some amount of blue light, therefore blue light protection filter with retina protection factor 30 (RPF-30) was applied to LED screen so that it could act as another screen interface. The same participants were exposed to the LED screen interface and blue light filter interface. During the screen exposure, cognitive tasks were performed by participants to measure sustained attention and memory performance. It was assumed that EEG low frequency delta-theta activity attenuates with continuous exposure of LED backlit screen. EEG and KSS were used as objective and subjective measures to quantify sleepiness. For mood assessment, visual analogue mood scale was used. Finally, repeated measure ANOVA was used for statistical analysis.
OBJECTIVES
Keeping in view all the previous research, the major objectives, thus emerged are as the following:
1) To understand various existing methods for evaluation of cognitive performance.
2) To study the effects of blue light on cognitive functions.
3) To investigate effects of blue light on circadian rhythm using subjective and objective methods.
METHODOLOGY
Participants were voluntarily recruited from PEC University of Technology. All seven participants were healthy young male (age range, 23-26 years; mean 24 ± 1 Standard Deviation). The entire study procedure was explained to the participants individually. Visually impaired participants with colour blindness and diminished pupils were excluded from the study. Participants who wear glasses were also included. Smoking, caffeine, alcohol, and drug consumptions were set as exclusion criteria. Participates were advised to avoid these things during the experiment and to follow a regular sleep-wake cycle.
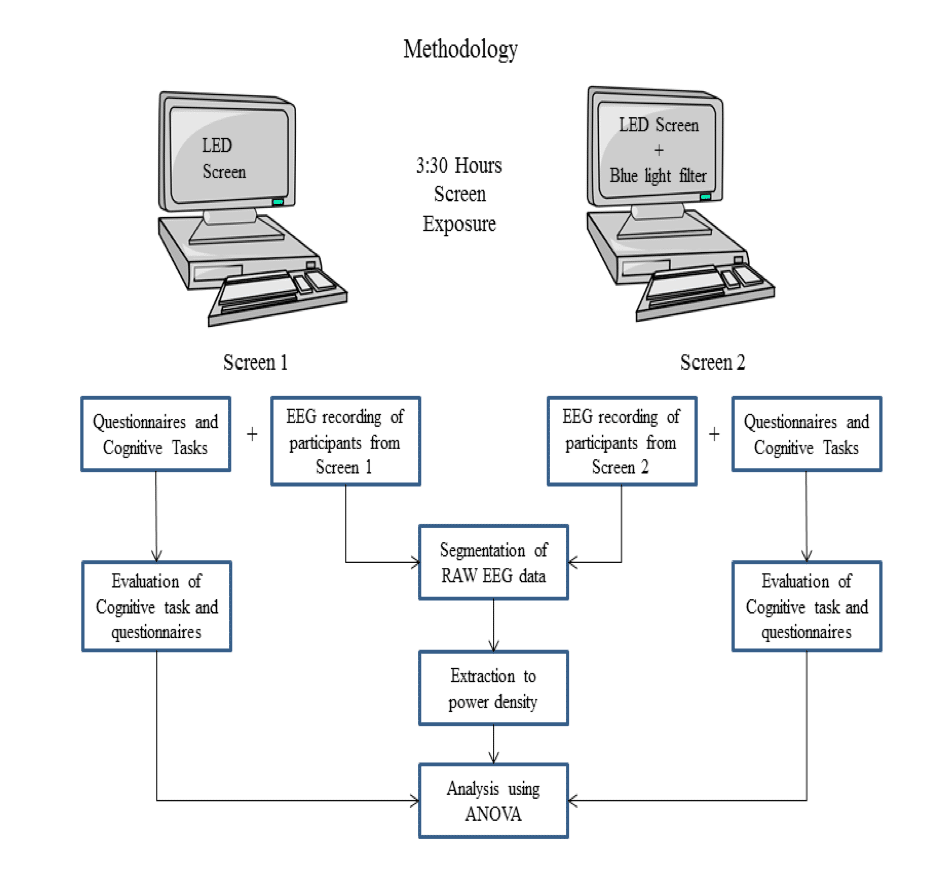 The entire study was composed of two parts. Firstly, seven participants were called one by one each day to perform some series of tasks on the LED screen interface. After the first part of the study was done same participants were recalled to perform same tasks on blue light filter interface (filter was attached to LED screen). Study duration was set to 5 hours, which included EEG electrode placement and dark adaptation followed by three and half hours (3:30 Hours) bright screen exposure. All Subjects were asked to arrive a half hour before the study, where the whole procedure was explained to them. During the dark adaptation laptop screens were turned off for 30 minutes. EEG, KSS and VAMS were performed on an hourly basis. All the participants remained in the seating position for 5 hours therefore, ten minutes rest was provided twice in the study followed by cognitive tasks. Each cognitive task lasted for 30 minutes. To get more exposure on eyes a short movie (40 minutes) with a white background was shown between the two cognitive tasks.
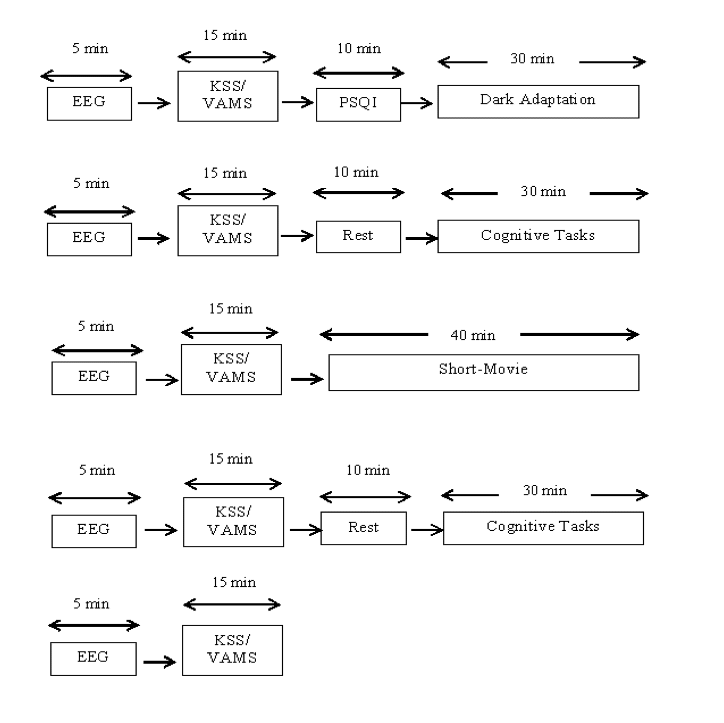 Figure 2: Protocol design with time frame of different tasks
COGNITIVE ASSESSMENTS
Subjective Assessment
1) Visual Analogue Mood Scale (VAMS)
2) Karolinska Sleepiness Scale (KSS)
Visual Analogue Mood Scale
Visual analogue mood scale (VAMS) was used as a subjected measure to evaluate mood. This 100mm vertical scale was composed of seven sub-scales with labels “Happy-Sad” “Miserable-Satisfied” ”Peaceful-Distressed” “Excited-Bored” “Calm-Afraid” “Peaceful-Angry” and “Sleepy-Alert” on the both ends. A vertical scroll bar was placed between these two labels which provided values from 0-100. On the left side there was a male face with different expressions which changed as the scroll bar is dragged. For each of the scales user had to adjust their facial expression that best reflect their mood. For assessment all the scales were merged by taking the mean value to form a single scale with labels “Pleasant-Unpleasant”
Karolinska Sleepiness Scale
Karolinska Sleepiness Scale is a 9-point self-assessment scale. It is used very often in sleep measurements. Subjects were asked to rate their drowsiness at hourly intervals. KSS is ranked from “1 to 9” with labels “extremely alert” to “extremely sleepy”. Only odd numbers label in the original scale. In modified KSS scale, even and odd both numbers are labelled hence it was used during the study.
Objective Assessment
Electroencephalography(EEG)
To objectively analyse sleep, 5 minutes EEG was done (2 minutes eyes close; 3 minutes eyes open). EEG data was collected and stored offline from frontal “Fz”, Central “Cz”, parietal “Pz” and occipital “Oz” derivations. EEG was recorded using 24 channels Clarity braintech system with real time video recording feature. Electrodes were placed on the scalp using 10-20 international system. Adhesive and conductive gel/paste were used to make a stable contact with the scalp. Low pass filter was set to 1Hz while the high pass filter was set to 70Hz. The gain was set to 7.5μV/mm and notch filter was turned ON during the recordings. EEG data were analyzed using biopac student lab (Acqknowledge version 4.1). Artifact free data were manually detected from 3 min eye opening session. EEG data was segmented into small epochs of 10 seconds. Digital filters were used to filter unwanted frequency bands. Then ten second artifact free data were further subjected to power spectral density using fast Fourier transform routine (FFT). Spectral power was calculated for four EEG derivations Fz, Cz, Pz and Oz.
Cognitive Tasks
1) Sustained Attention
2) Number Memory Task
3) Verbal Memory
4) Visual Memory Task
Sustained Attention: Reaction time task was used to measure sustained attention that is the ability to focus on a single task. In this task red light was shown on the screen, participates were instructed to click the mouse as soon as red light turns green. Five trials were taken from each candidate for each time the task was performed. For data reduction mean value of five trials was calculated for each individual.
Number Memory Task: Number memory task was used to quantify working memory. In this task a random number was displayed on the screen, followed by 4 second delay, users were told to memorize that number and type the digits in the response window. Number of digits increased for each correct answer. This task ended when wrong digit was entered in the response window. An average person could memorize up to 7 digits of number. The idea behind this task was to check the effects of blue light on working memory.
Verbal Memory Task: Short term memory was assessed by verbal memory task. Instead of numbers, words were shown in this task. With each word displayed on the screen there were two options, namely “seen or new”, participants had to select one option out of these two using mouse buttons. With every correct answer score “1” was added to the result and with each wrong answer “1” chance was deducted. Total three chances or lives were given before the task terminates.
Visual Memory Task:Active memory was tested via visual memory task. A matrix of “6×6” that is 36 tiles were displayed on the screen. 18 number-pairs were hidden behind 36 tiles. The goal of this task was to find out a matching pair of the numbers as soon as possible. For this participants were told to visualize the location of a particular number and find its matching pair. Time taken to perform this task was noted in seconds.
STATISTICAL ANALYSIS
Statistical analysis was performed using SPSS Statistics (version 20) and Minitab 17. Statistical analysis was carried out for each task (number memory, verbal memory, visual memory, reaction time task, auditory task, and word-pair learning) including mood and sleep scales. General linear modelling (repeated measure r-ANOVA) was used to find a significant difference between mean values as shown in Table 1 and Table 2. Following factors were used in the analysis:
- Screen (LED screen, blue light filter screen)
- Time of the day (T1, T2, T3, T4, T5)
- EEG derivations (Fz, Cz, Pz, Oz)
- Cognitive tasks (Task1, Task2)
| Analysis of variance (Factor-Screen) | ||||||
| Variable | KSS | VAMS | Sustained attention | Number memory | Verbal memory | Visual memory |
| F-value | F1,60 = 4.43 | F1,68 = 4.08 | F1,24 = 4.62 | F1,12 = 5.52 | F1,24 = 4.97 | F1,12 = 4.76 |
| P- value | P = 0.040 | P = 0.047 | P = 0.042 | P = 0.037 | P = 0.035 | P = 0.049 |
Table 1. Analysis of variance of cognitive tasks, karolinska sleepiness scale, and visual analogue mood scale
| Analysis of variance (EEG) | ||||
| Variable | Screen | Channel | Channel × Screen | Time × Screen |
| F-value | F1,240 = 4.36 | F3,240 = 11.60 | F3,240 = 3.12 | F4,240 = 3.69 |
| P- value | P =0.038 | P <0.001 | P =0.027 | P =0.006 |
Table 2. Analysis of variance of EEG (factors and interactions)
RESULTS & DISCUSSION
The Karolinska sleepiness scale was rated hourly and further analyzed by repeated measure anova showed a significant effect for “screen” (F1, 60= 4.43; P = 0.040), as represented in Table 1 but, no significance for the time or interaction time versus screen. KSS mean score after first cognitive task (14:20 hour) was similar for both the screens, but after second cognitive task (16:20 hours) it varied. From Fig 3 it wasclear that participants who performed on LED screen were more alert throughout the study as compared to participants who performed in front of a blue light filter screen.
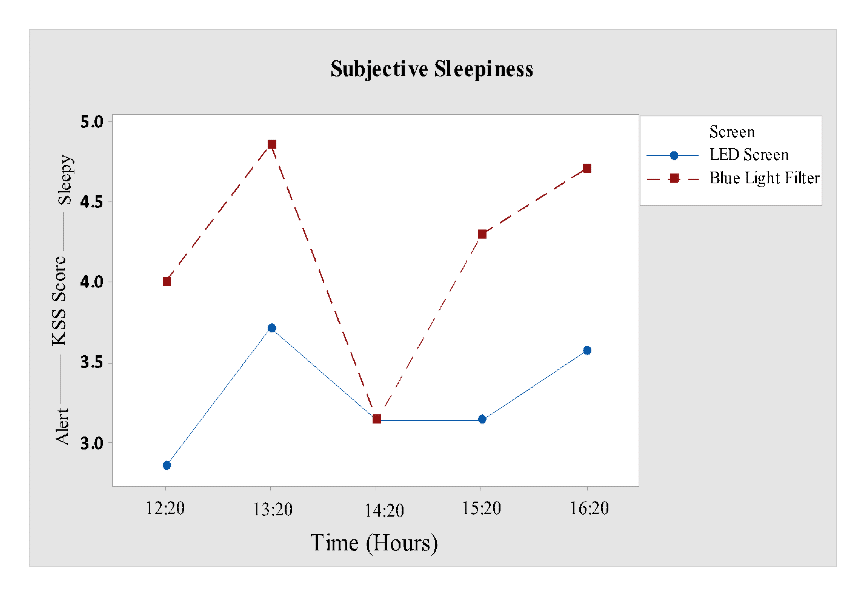 Figure 3: Graphical representation of subjective sleepiness.
Mood ratings were also taken at the same time intervals as KSS. The mood scale versus screen showed a significant effect for factor “screen” (F1, 68 = 4.08; P = 0.0470). It acknowledged more unpleasantness in participants who were subjected to LED screen interface as compared to blue light filter interface. No significant effect was revealed for interaction screen versus time. It was clearly seen in Fig 4 that mood of participantsexposed to blue light filter is much more pleasant than LED screen participants.
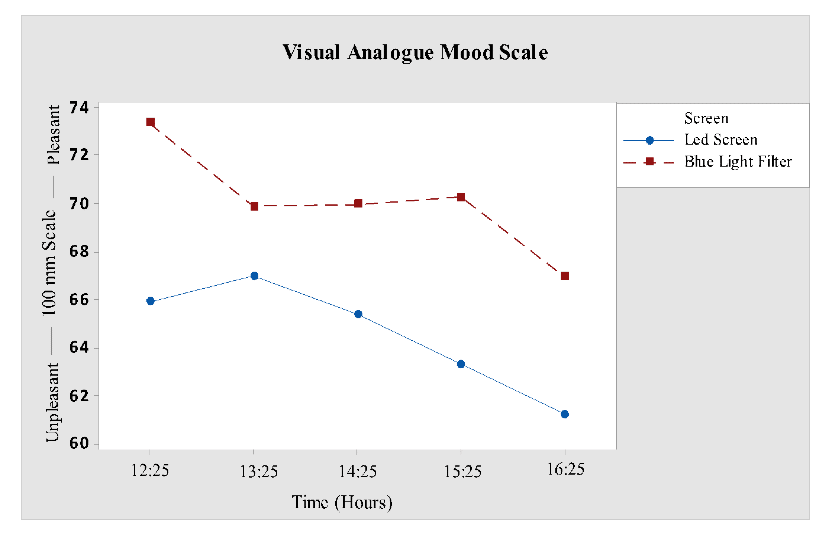 Figure 4: Graphical representation of VAMS for two screen interfaces.
For EEG power density analysis, multi-factors; derivations, screen interface, time with multi-levels were tested using general linear modelling. Significant values were observed for factors, derivation (F3, 240= 11.60; P < 0.001), screen (F1, 240 = 4.36; P = 0.38) and interactions, derivation versus screen (F3, 240 = 3.12; P <0.03) and time versus screen (F4, 240= 3.69; P = 0.006), data revealed in Table 2. Results showed that EEG delta-theta activity was more prominent in frontal region compared to others, as shown in Fig 5.
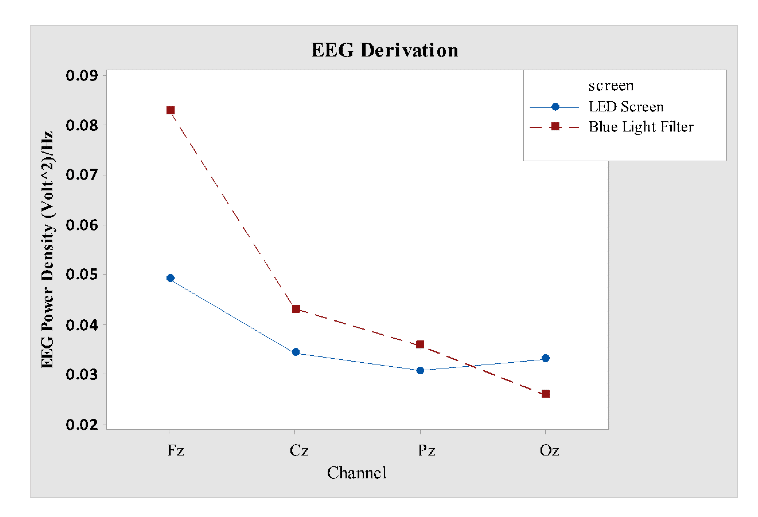 Figure 5: Graphical representation of EEG channels at different times of the day.
Further analysis of the frontal region (Fz versus screen, time) revealed significant value for faster screen (F1, 60= 5.10; P = 0.028,). From Fig 6 it was clear that EEG power increased only for blue light filter participants and attenuated for LED screen users except at 14:15 hours where blue light filter participants were more alert after their first cognitive task. But after second cognitive task at 16:15 hours EEG power dropped for blue light filter participants.
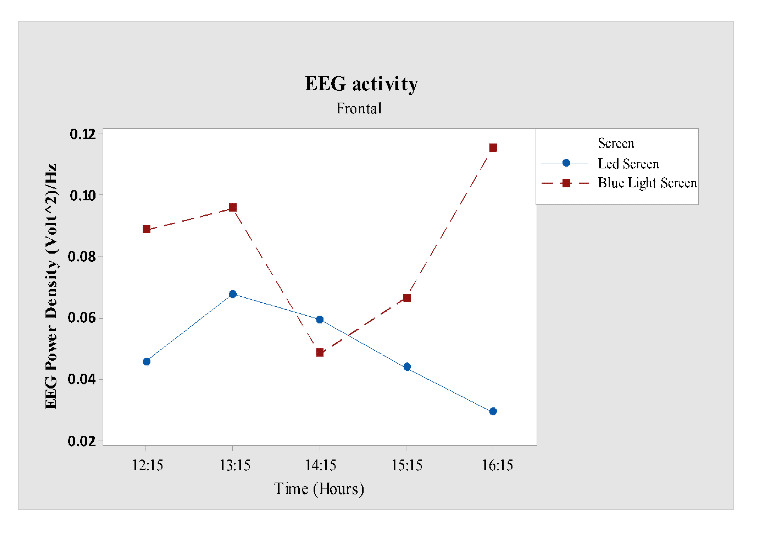 Figure 6: EEG power mean values of seven participants for two screen interfaces
Number memory task (marked as working memory) did not reveal any significant difference in time of the day, therefore, tasks were independently compared to factor screen which revealed significant differencesin screen (F1, 12= 5.52; P = 0.037). From Fig 7 it is clear that, in first task, participants subjected to blue light filter screen scored much better than LED screen participants. But performance of participants who were exposed to the LED screen increased with time and they scored more than blue light filter participants in the second task.
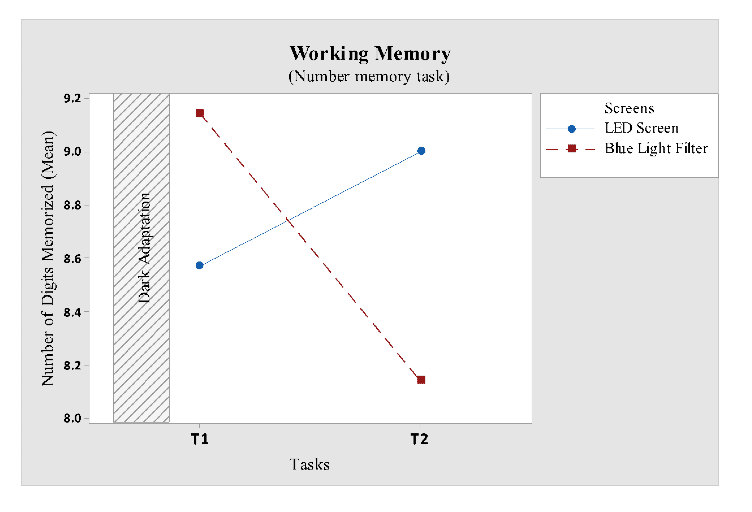 Figure 7: Mean plot of number memory task for LED and blue light filter screen.
Verbal memory task didn’t yield differences in factor time and interaction of time and screen, but it yielded tendency for screen (F 1, 24 = 4.97; P = 0.037). Verbal memory performance gradually decreased for both the screens, but scores of blue light filter screen was higher than LED screen throughout the tasks. The difference in scores for both screen interfaces can be seen in Fig 8.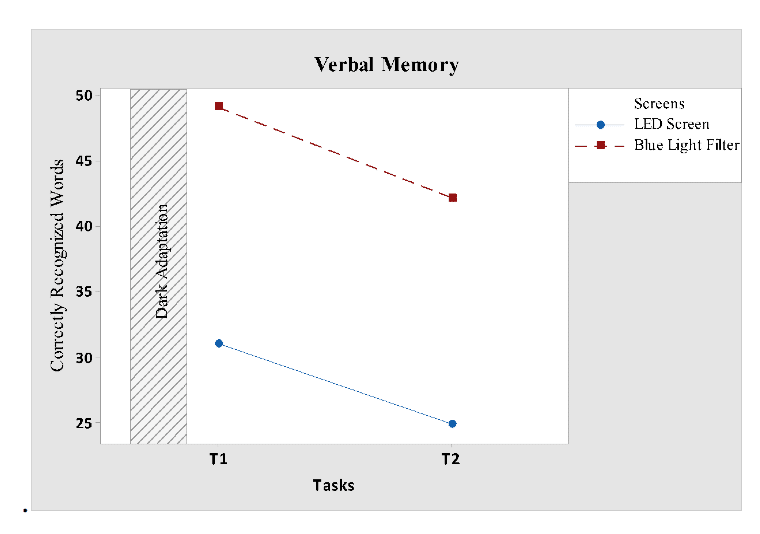
Figure 8: Verbal memory mean score plot for two screen interfaces
Sustained attention shown in Fig 9 indicates that reaction time significantly increased for participants who were subjected to blue light filter screen. For general linear model, (reaction time versus screen, task) factor screen revealed (F1, 24= 4.62; P = 0.042), as illustrated in Table 1. Task versus reaction time did not suggest any significance. While when tested with one-way ANOVA (reaction time vs screen) revealed significance for screen (F1, 26= 4.86; P = 0.037).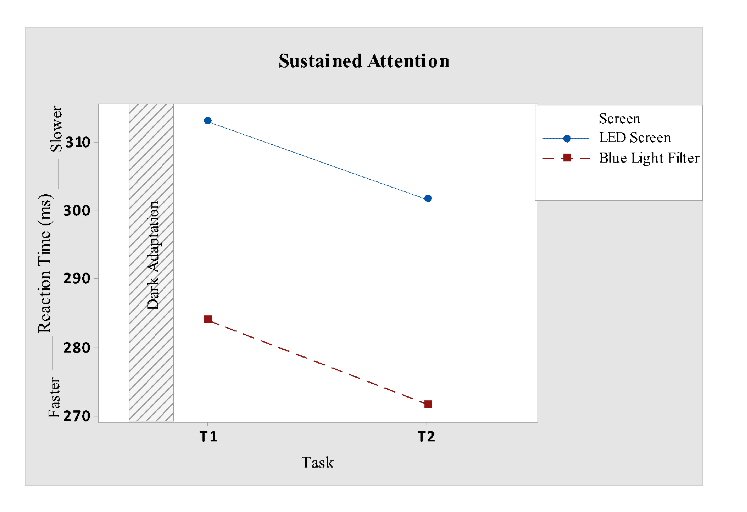 Figure 9: Mean reaction time plot of two screen interfaces
Visual memory or active memory task gave no evidence for factors screen and task, but when further investigated it revealed a significant differencein task 2 score versus screen (F1, 12 = 4.76; P < 0.05). Response time of LED screen participants was constant in both the tasks, as shown in Fig 10 whereas response time of blue light filter participants improved with time. Therefore a significant difference was found during the second task for both the screen interfaces.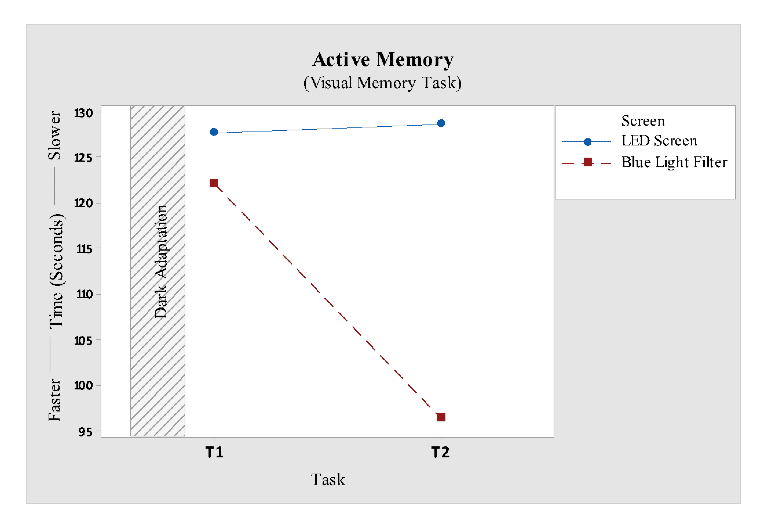 Figure 10: Mean plot of visual memory task (measured in seconds).
CONCLUSIONS
The purpose of this study was to find the effects of blue light exposure on human cognitive performance. Cognitive functions, for which effects of blue light were observed, are mood, memory performance, attention and sleepiness. From the study following conclusions were made:
- Participants exposed to blue light filter screen were more cheerful than LED screen participants.Exposure of blue light emitted by LED screen was responsible for unpleasant mood which could also lead to depression.
- Alertness was more observed in participants who were exposed to the LED screen. Whereas participants who were exposed to blue light filter screen were drowsier. It concludes that blue light suppresses drowsiness.
- Memory performance of participants who performed on blue light filter screen was better than LED screen. Hence blue light exposure affects the ability to hold information in mind and interferes with short term memory.
- In sustained attention task reaction time of LED screen participants was slower than blue light filter screen participants. Therefore, blue light exposure disrupts the ability to focus on a single task.
It was found that exposure to the LED screen decreased mood and memory performance of participants. When exposed to blue light filter screen, same participants performed better as compared to LED screen. Therefore, usage of a blue light filter which can block short-wavelength light is the best approach to avoid blue light hazards.
REFERENCES
Åkerstedt, T., Hume, K.E.N., Minors, D. and Waterhouse, J.I.M., 1994.The subjective meaning of good sleep, an intraindividual approach using the Karolinska Sleep Diary. Journal of Perceptual and motor skills, Vol 79 Issue 1, pp.287-296.
Avery, D.H., Eder, D.N., Bolte, M.A., Hellekson, C.J., Dunner, D.L., Vitiello, M.V. and Prinz, P.N., 2001. Dawn simulation and bright light in the treatment of SAD: a controlled study. Journal of Biological psychiatry, Vol 50 Issue3, pp.205-216.
Buysse, D.J., Reynolds, C.F., Monk, T.H., Berman, S.R. and Kupfer, D.J., 1989. The Pittsburgh Sleep Quality Index: a new instrument for psychiatric practice and research. Journal of Psychiatry research, Vol 28, Issue 2, pp.193-213.
Cajochen, C., Munch, M., Kobialka, S., Krauchi, K., Steiner, R., Oelhafen, P., Orgul, S. and Wirz-Justice, A., 2005. High sensitivity of human melatonin, alertness, thermoregulation, and heart rate to short wavelength light. The journal of clinical endocrinology & metabolism, Vol 90, Issue 3, pp.1311-1316.
Cajochen, C., Frey, S., Anders, D., Späti, J., Bues, M., Pross, A., Mager, R., Wirz-Justice, A. and Stefani, O., 2011. Evening exposure to a light-emitting diodes (LED)-backlit computer screen affects circadian physiology and cognitive performance. Journal of Applied Physiology, Vol 110 Issue 5, pp.1432-1438.
Chellappa, S.L., Steiner, R., Blattner, P., Oelhafen, P., Götz, T. and Cajochen, C., 2011. Non-visual effects of light on melatonin, alertness and cognitive performance: can blue-enriched light keep us alert?. Journal of PloS one, Vol 6, Issue 1, pp.164-29.
Daneault, V., Hébert, M., Albouy, G., Doyon, J., Dumont, M., Carrier, J. and Vandewalle, G., 2014. Aging reduces the stimulating effect of blue light on cognitive brain functions. Journal of Sleep, Vol 37, Issue 1, pp.85-96.
Doran, S.M., Van Dongen, H.P.A. and Dinges, D.F., 2001. Sustained attention performance during sleep deprivation: evidence of state instability. Journal of Archives italiennes de biologie, Vol 139,Issue 3, pp.253-267.
Gabel, V., Maire, M., Reichert, C.F., Chellappa, S.L., Schmidt, C., Hommes, V., Viola, A.U. and Cajochen, C., 2013. Effects of artificial dawn and morning blue light on daytime cognitive performance, well-being, cortisol and melatonin levels. Chronobiology international, Vol 30, Issue 8, pp.988-997.
Horne, J.A. and Ostberg, O., 1976. A self-assessment questionnaire to determine morningness-eveningness in human circadian rhythms. International Journal of chronobiology, Vol 4,Issue 2, pp.97-110
Kim, H., Kim, H.S., Jung, C.H. and Yoon, I., 2015. A Method for Reducing Blue Light Hazard from White Light-Emitting Diodes Using Colourimetric Characterization of the Display. International Journal of Control and Automation, Vol 8 Issue 6, pp.9-18.
Lehrl, S., Gerstmeyer, K., Jacob, J.H., Frieling, H., Henkel, A.W., Meyrer, R., Wiltfang, J., Kornhuber, J. and Bleich, S., 2007. Blue light improves cognitive performance. Journal of neural transmission, Vol 114, Issue 4, pp.457-460.
Reid, G.J., Huntley, E.D. and Lewin, D.S., 2009. Insomnias of childhood and adolescence. Journal of Child and adolescent psychiatric clinics of North America, Vol18,Issue 4, pp.979-1000
Schmidt, C., Peigneux, P., Muto, V., Schenkel, M., Knoblauch, V., Münch, M., Dominique, J.F., Wirz-Justice, A. and Cajochen, C., 2006. Encoding difficulty promotes postlearning changes in sleep spindle activity during napping. Journal of Neuroscience, Vol 26, Issue 35, pp.8976-8982.
Viola, A.U., James, L.M., Schlangen, L.J. and Dijk, D.J., 2008. Blue-enriched white light in the workplace improves self-reported alertness, performance and sleep quality. Scandinavian Journal of work, environment& health, Vol 12, Issue 16 pp.297-306.
Warman, V.L., Dijk, D.J., Warman, G.R., Arendt, J. and Skene, D.J., 2003. Phase advancing human circadian rhythms with short wavelength light. Journal of Neuroscience letters, Vol 342,Issue 1, pp.37-40.
Winocur, G., Moscovitch, M. and Bontempi, B., 2010. Memory formation and long-term retention in humans and animals: Convergence towards a transformation account of hippocampal–neocortical interactions. Journal of Neuropsychologia, Vol 48,Issue 8, pp.2339-2356.